
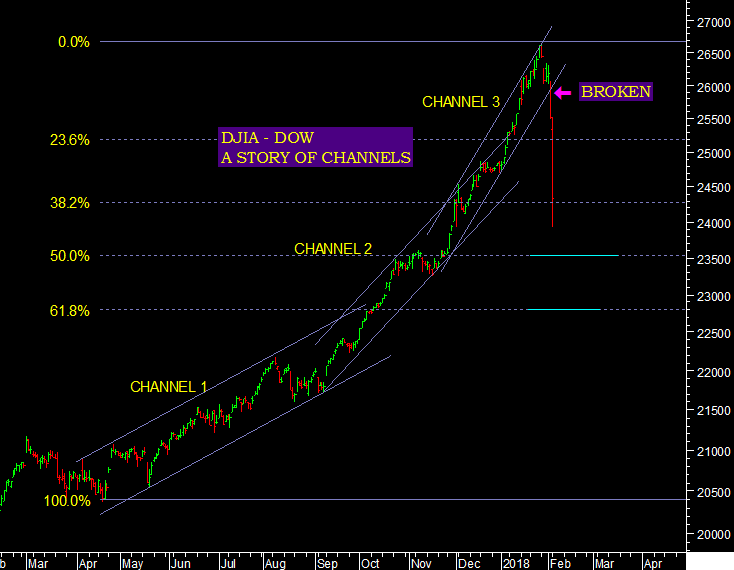
Dow - a story of channels
6 Feb 2018 ● 04:28 AM
A story of Channels - repeated. I covered this chart 2 weeks ago as the third channel was progressing and gave the breakdown level. We closed below it on Friday and the rest is history. Whether you take the Pharma index or stocks like Sun Pharma 2 years ago or Tech stocks from the Y2K bubble they witnessed a similar parabolic rise in channels till broken and once broken the trend had changed for the next 1-2 years. 50% of wave 5 is at 25320 and 61.8% at 22800. One of the two may see wave A down complete, and wave B up start.
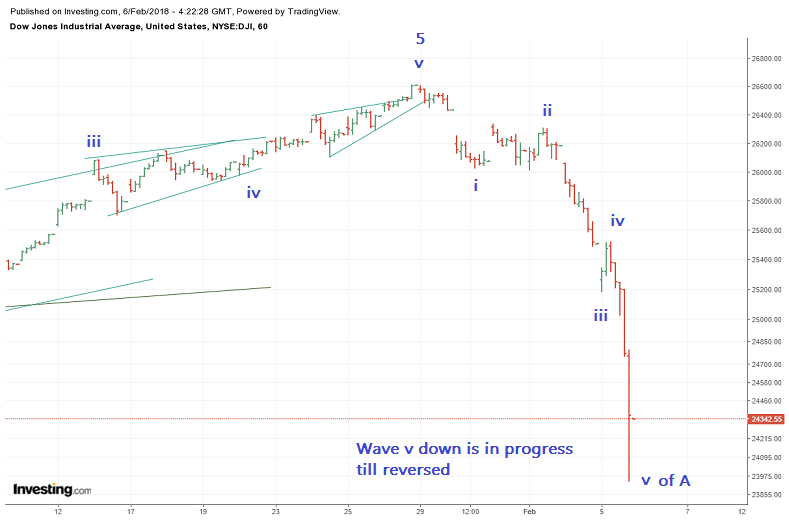
Near term the hourly chart of the Dow can spot a 5 wave decline and we are in wave v down. So once complete we can expect our first dead cat arrival. Wave v of A is in progress till we get a reversal from one of the retracements shown above.
Comments (0)
Sort by
Latest First
Oldest First