
US Indices
16 Jan 2016 ● 08:16 AM
The US, yes that crashing market that does not want to seem to stop even as sentiment in in the lower single digits for the number of bullish advisors. So let me go over some observations as we decide that the Great US bear market has indeed started.
I discussed the Transports early this week. And it is not much lower, but the size of the fall in percentage terms [log scale is now the same as the fall last see in 2011.

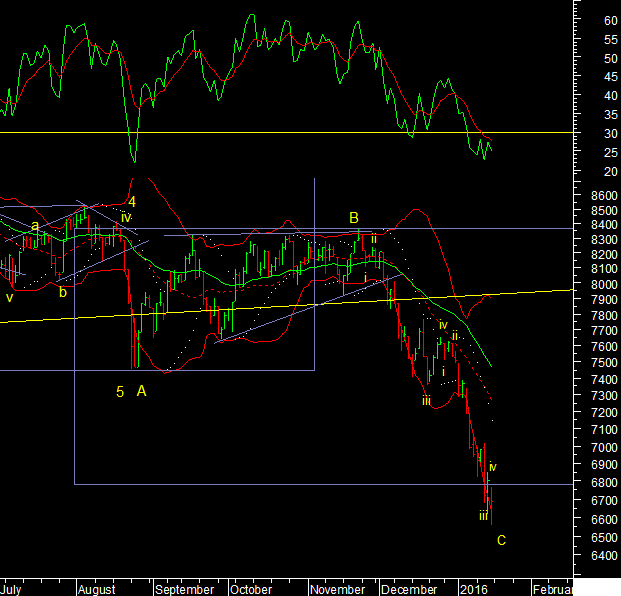
Clearly wave B was a triangle so wave C has to complete in 5 waves. The daily chart below does show that we are in wave v of C down which could be the last push lower for now. Whether this is wave C ending or wave 1 of C, and will the next move up be only an X wave is a separate discussion and we do not know the answer. But after a 5 wave fall we should see some retracement of that fall to start with.
In Oct I posted all the channel charts of the US. So let us look at them again. The Nasdaq 100 again. Note these are on arithmetic scale. After taking support on the channel it was the only index that managed a new all time high. And it has now fallen back to the channel line.
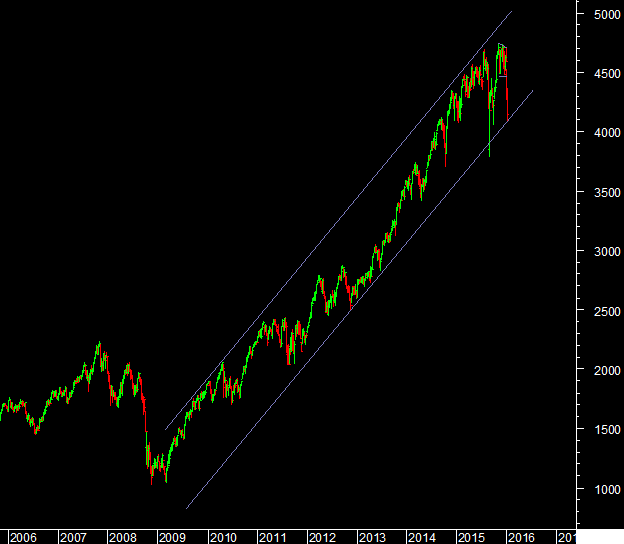
I am using weekly charts. I am using reverse channels. On the S&P I made a reverse channel from the 2011 highs that gave support in Sept. Now I am taking the 2010 high to include all price activity. And we are now near the lower end of the channel at 1850.

Comments (0)
Sort by
Latest First
Oldest First