
Dow Transports
22 Mar 2013 ● 05:25 AM
Some time back I mentioned that US markets are close to completing vth waves. I also showed why I changed my counts in S&P to A-B-C medium term. The reason was a running triangle in the Transports. So I show that today
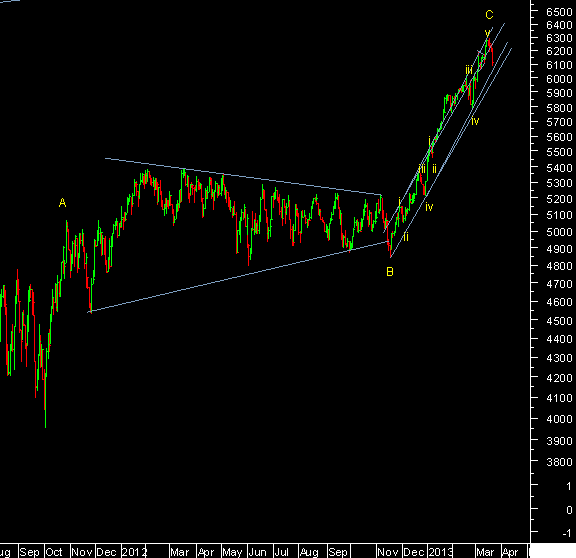
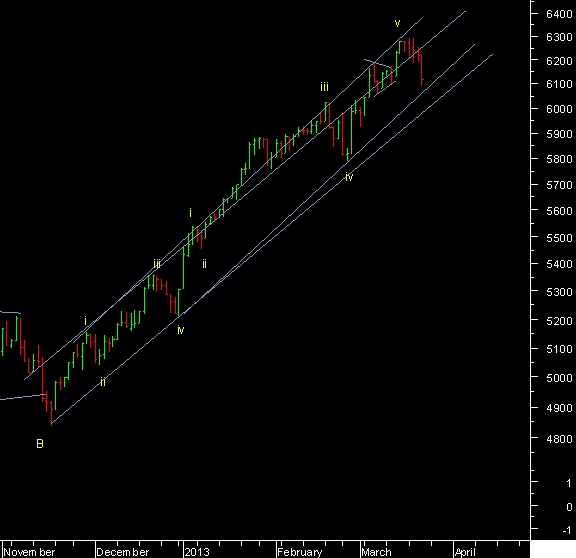
The above chart shows the overall structure. Which means that wave C should be an impulse and we were in wave v of V of an impulse in most US indices in the last few days, which have now all together given sell signals in short term momentum. A further confirmation of trend reversal would be a break below the 20dma and rising trendlines. For the transports that is at 6070 as shown below. A break should confirm a long term top for US markets after the recent rally. Let me also add the chart of Dow.
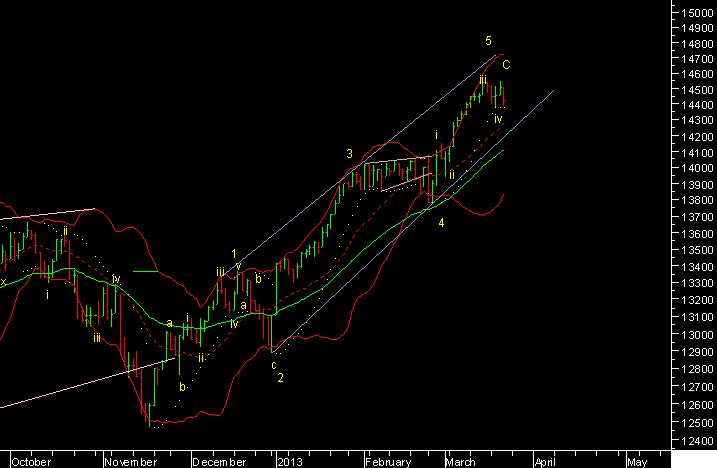
The DJIA below has its 20dma at 14277 and trendline at 14228. The wave count appearing complete these levels should be under threat.
Comments (0)
Sort by
Latest First
Oldest First