
S&P - Back to the Drawing board
3 Jan 2014 ● 04:37 AM
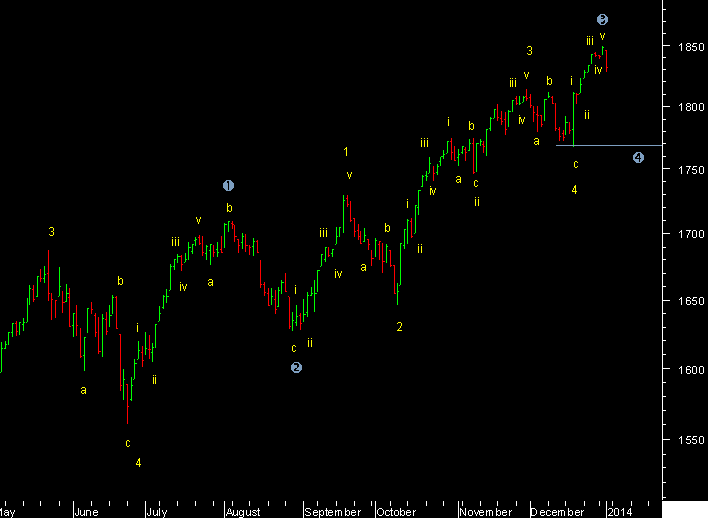
For the nth time its possible to mark a small 5 wave advance on the S&P from the December low to Jan high. So took a blank look at what I have been doing since June. At the June low the large Flag I marked as wave 4 and since then have been trying to end wave 5 in either a wedge or a 5th wave following a running triangle. However every time a rally was a small five I marked it and we got a 2-3 week correction [a-b-c, 3 waves] then a new rally. So removing the wedge and triangle marking all the 5's up and a-b-c down, the result was the following chart. A series of impulses as part of an extended 5 waves. And by this count 2 things can be said. First since we have a short term 5 wave structure we will again see a correction. Second the correction itself might be another larger degree 4th wave. A 4th wave of higher degree might correct up to wave 4 of the lower degree that is 1720, that is the target now. And after that one more new high in wave 5/5 might be on the cards. Since there are so many wave sub-divisions one can force fit the end if you include previous data from 2011 onwards. But for the time being we should have a top for the short term and will figure out if it leads to a medium/longer term top as well or not. The answer would come based on whether the decline is once again a-b-c or a 5 waves down.
In the second chart below I show the pattern from 2011 on a weekly chart and how if you mark a triple Zig-zag on the chart from there you can mark a top at the recent high of larger degree.[Y ending].

Comments (0)
Sort by
Latest First
Oldest First