
The 5th wave
30 Jul 2016 ● 02:36 PM
In Jan when US stocks held their reverse parallel channels I posted a series of charts showing why wave 5 up could start for them. Later I did not think these counts may play because the Transports had broken down too much and so had the Global index. But then we have a new high in the US markets with 6 consecutive positive months so it is possible to mark this recent rally as wave 5.
Here is the Dow

Here is the nasdaq 100. This one is interesting as visually we can mark a triangle for the 4th wave [blue lines].
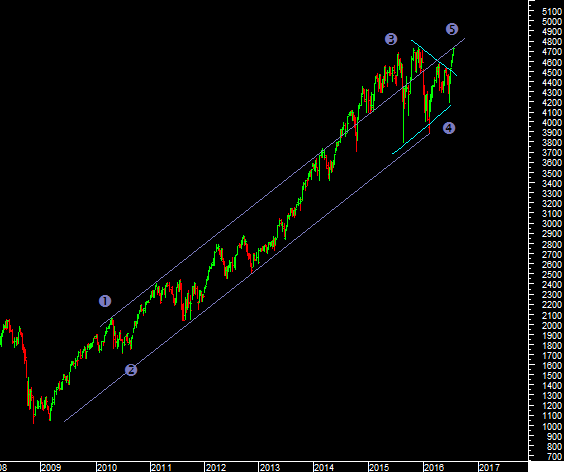
The question then is how far can wave 5 go? Well we can keep on extending targets to a bubble but we are at the first level where sentiment has reached an extreme so we should consider the near term top first. If the next correction holds retracements then consider wave 5 extentions else wave 5 can truncate and end as well.
Comments (0)
Sort by
Latest First
Oldest First