
US Equities All together now
2 Dec 2014 ● 06:13 AM
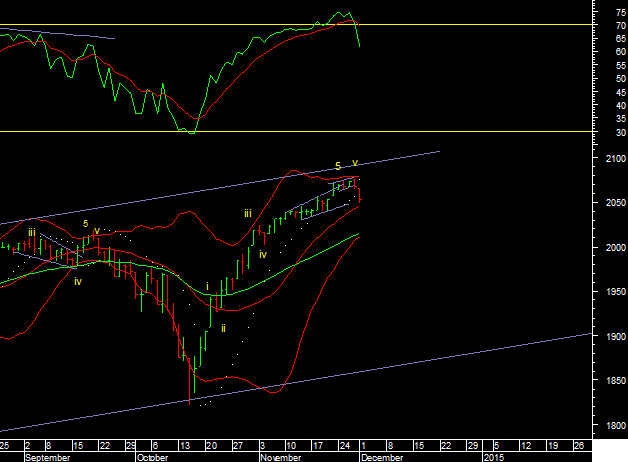
US equities sold off yesterday but with a lot of variation. The S&P completed the ending diagonal I showed on hourly charts last week and broke below it. Daily momentum is already in sell mode, and 5 waves appears complete as below and a drop to 2012 on the S&P at least is on.
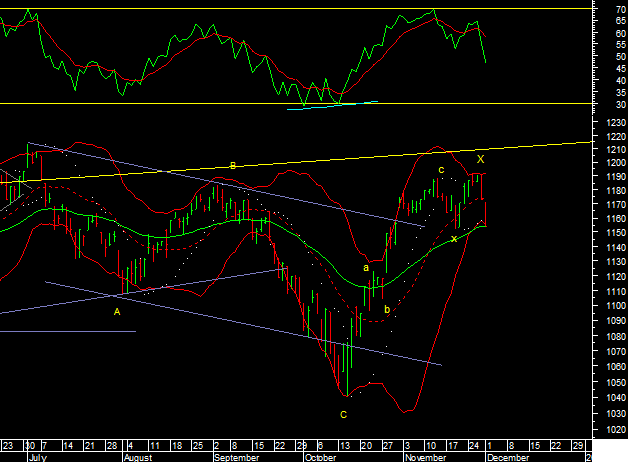
However the lead was taken by other indices like the Dow transports that closed below the 20dma already after a inverted hammer the previous day.
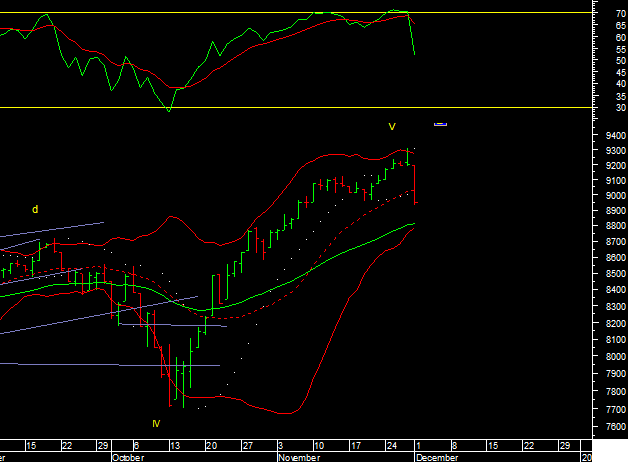
The Russel 2000 of small stocks was leading the way and reached the 40dema already.
The Nasdaq was the largest loser yesterday and formed an evening start candlestick pattern once we see follow up selling this pattern marks important near term tops or a selling resistance where bears are stronger.

Comments (0)
Sort by
Latest First
Oldest First