
Dow and the RSI
8 Jan 2018 ● 07:15 AM
There was a post on Instagram telling me that RSI is not a good indicator for bull markets as in a trending market it will give false signals. True and even more so in bubbles. Tech stocks like Infosys sported quarterly RSI above 90 for a long time. Even other speculative stocks saw readings often over shoot. And at that point of time using elliott waves with channels allowed for making projections for more upside when prices confirmed an extension. However after that upside sometimes you did get a correction and sometimes a consolidation. But eventually not paying attention to the final reversal was costly because what followed was the Tech bust.
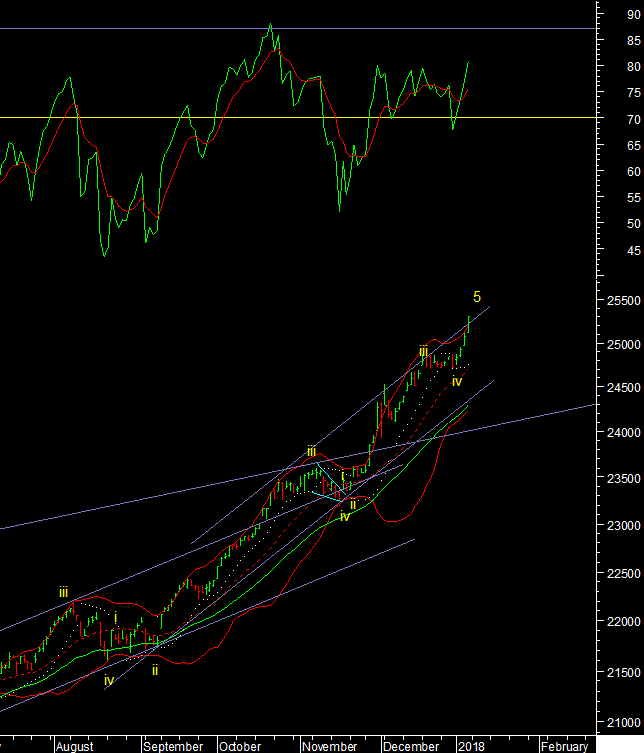
So stating that the daily RSI was high in Oct'17 did see the Dow consolidate for several weeks [see chart], afterwards it took off and extended the fifth wave in a new rising channel. Now that we are overshooting the upper channel and RSI is at 80 should we take note? The RSI number stand alone might not be so relevant as previous readings were near 88. But there is something else in multi time frame analysis. When the RSI hits a record high across time frames the resulting correction can be more brutal. At least that was true in the past [recent history shows all past observations ignored by the market], but this kind of reading on RIL allowed me to call the Crash of May 2006 when the Nifty lost 30% in a month.
So there are very few rare occasions with such a reading on the Dow, very few times including 1987, the often quoted crash that included black Monday. The reading today is like this, RSI 81, 88, 88, 85, 83, on daily, weekly, monthly, quarterly, yearly respectively.
Comments (0)
Sort by
Latest First
Oldest First