
NYSE Composite
27 Feb 2018 ● 05:08 AM
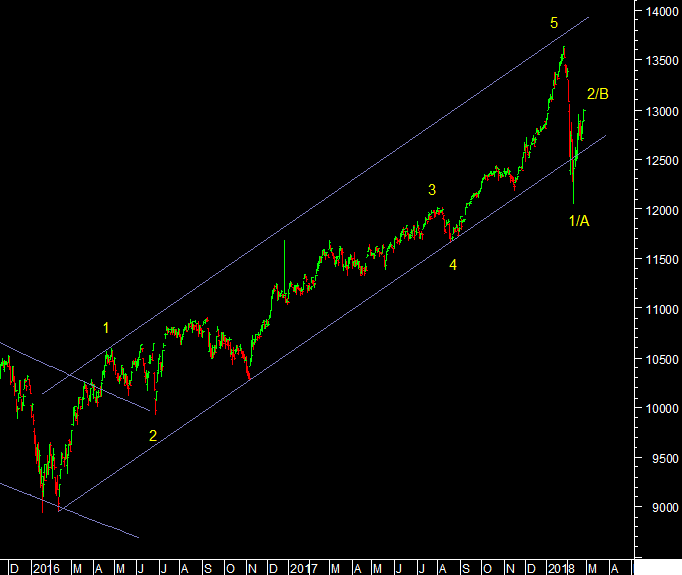
At the end of the 3rd wave on this chart I actively covered this index because it had a perfect ending diagonal there and that pattern allowed me to call that top. This index is a composite of almost 2000 stocks and so very broad based. It captured the 2015 decline which was much steeper than appeared in the S&P. So I am covering it after a long time. Wave 5 touched the upper end of the parallel channel and sold off. There is in fact a small throw over as prices attempted to go above the upper line but failed to hold. This is an arithmetic scale, chosen just because of best fitting channels.

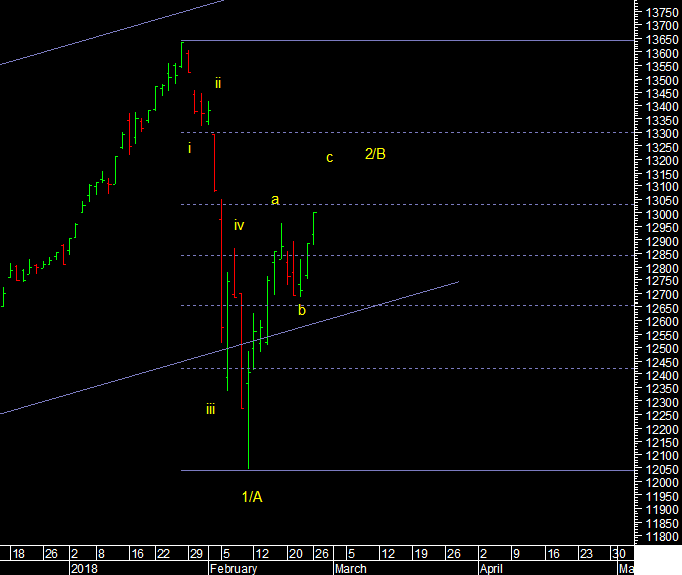
On this index so far we are in retracement of the fall. 13030 is 61.8%. After breaking the 2016-2018 channel prices are trying to make a come back.
After a 5 wave decline in 1/A, wave 2/B is going on. This is three waves a-b-c and we are in c. wave c can end at 61.8% or overshoot to 78.6% but once it turns we should expect another 5 wave decline.
Comments (0)
Sort by
Latest First
Oldest First